Dialed Color

color

Humans can't reliably recall colors. This assessment measures how closely you can recreate target colors after a short delay.

We'll show five target colors, then you'll rebuild each one from memory.

Solo or multiplayer?

Color memory direct answer

Color Memory Test

Color Memory Test measures short-term recall for color appearance. You see a target color, wait briefly, then recreate hue, saturation, and brightness from memory.

The score uses CIEDE2000 Delta E after converting target and submitted colors into Lab-style coordinates. Delta E is the measurement vocabulary; the 0-10 score is a product-calibrated display curve.

This is not a color-vision diagnosis or professional certification. Screen calibration, brightness, color profile, ambient light, and device differences can change results.

Evidence at a glance

5 rounds per standard run
3 HSB controls: hue, saturation, brightness
Delta E 00 CIEDE2000 color-difference basis
3 visible source references
Target source

Seed-generated HSB targets, so the same seed can reproduce the same run.

Measurement

CIEDE2000 Delta E plus hue, saturation, and brightness drift summaries.

Report use

Average Delta E, strongest drift direction, round consistency, and same-seed comparison.

Boundary

Not a clinical color-vision test, color-grading certificate, or permanent visual-memory claim.

Evidence

What authority supports this test?

The app converts target and submitted colors into RGB and CIE Lab coordinates, then measures color difference with the CIEDE2000 Delta E formula.

The cited CIE and W3C sources support color-difference and color-space concepts. They are not endorsements or certifications of Dialed Color.

Target fairness

How same-seed comparison stays fair

Bot Challenge is labeled as a system rival, not a hidden human.

Friend Challenge and Live Match use the same seed, difficulty, and round count, so both sides receive the same target colors and scoring model.

Limits

What can affect the result?

Screen calibration, brightness, color profile, ambient light, and the user's display all affect results.

Report meaning

What the color report should explain

A useful color report separates hue misses from saturation and brightness drift. One high-error round means something different from five medium-error rounds.

The report should also explain display limits, because the same target can look different across screens and lighting conditions.

Result analysis

How to read a color memory result

1 Start with total score

The 0-50 total is a quick summary of five color reconstructions. It is useful for comparison, but it does not explain the reason for the miss by itself.

2 Separate the drift

Hue drift means the color family moved. Saturation drift means vividness changed. Brightness drift means the remembered color became lighter or darker.

3 Check consistency

One bad round suggests a momentary miss; repeated medium misses suggest a stable memory pattern worth comparing with same-seed runs.

FAQ

Color memory FAQ

Is Delta E the score?

No. Delta E is the color-difference measurement. Dialed maps it to a 0-10 assessment score for readability.

Are the colors random?

They are seed-generated pseudo-random targets. Same seed, difficulty, and round count reproduce the same target set.

Why can my score change on another screen?

Different screens, brightness, color profiles, and ambient light can change perceived color.

Can this diagnose color blindness?

No. It is a memory and recreation task, not a clinical color-vision diagnosis.

Sound memory direct answer

Sound Memory Test

Sound Memory Test measures short-term pitch recall. The browser generates a target tone, you remember it, then recreate the pitch using the interactive tone control.

The report compares target Hz and submitted Hz with cents and ERB-rate distance. Raw Hz alone is misleading because pitch perception is not linear across the frequency range.

This is not a hearing exam, perfect-pitch diagnosis, or medical screening. Headphones, speakers, volume, background noise, and browser audio behavior can change performance.

Evidence at a glance

5 tones per standard run
1200 cents in one octave
ERB-rate perceptual auditory-distance basis
Web Audio local oscillator synthesis
Target source

Seed-generated Web Audio tones inside a fixed frequency range.

Measurement

Cents error and normalized ERB-rate distance instead of raw Hz difference alone.

Report use

Sharp/flat bias, low/mid/high target difficulty, average pitch error, and consistency.

Boundary

Not a hearing acuity test, pitch disorder test, or clinical auditory assessment.

Evidence

What authority supports this test?

The app compares target Hz and submitted Hz with cents plus ERB-rate distance, so pitch error is measured on logarithmic and perceptual scales instead of raw hertz alone.

The cited Web Audio and auditory-filter references support generated-tone synthesis and perceptual pitch-distance language. They are not medical validation.

Target fairness

How same-seed comparison stays fair

Bot Challenge compares the player against a transparent deterministic rival.

Friend Challenge and Live Match share the same seed, difficulty, and round count, so both sides hear the same generated target tones.

Limits

What can affect the result?

Headphones, speaker quality, volume, browser audio behavior, background noise, and hearing range can all change performance.

Report meaning

What the sound report should explain

A useful sound report shows whether the user tends to guess sharp or flat, whether errors grow in a specific frequency range, and whether recall is stable across rounds.

Because browser audio depends on hardware and environment, the report should include device and noise limitations instead of pretending the score is universal.

Result analysis

How to read a sound memory result

1 Use score as a summary

The total score summarizes five pitch reconstructions. It should be read with cents and ERB-rate distance, not raw Hz difference alone.

2 Look for sharp or flat bias

If guesses repeatedly land above the target, the memory is sharp-biased. If they land below, it is flat-biased.

3 Check frequency bands

Errors can cluster in low, mid, or high tones. That pattern is more useful than judging one isolated miss.

FAQ

Sound memory FAQ

Why not score by raw hertz?

A 20 Hz error has different perceptual meaning at low and high frequencies. Cents and ERB-rate distance are better pitch-memory summaries.

Are audio files copied from somewhere?

No. The test synthesizes tones locally in the browser with Web Audio.

Why do headphones matter?

Speakers, headphones, volume, background noise, and hearing range all affect how accurately a tone can be heard and remembered.

Can this diagnose perfect pitch?

No. It measures this short generated-tone recall task only.

Time memory direct answer

Time Memory Test

Time Memory Test measures interval reproduction. You experience a hidden duration, then recreate it without watching a timer.

The report compares target duration and submitted duration with absolute error, relative error, and log-ratio timing error. This makes early/late bias and proportional timing drift visible.

This is not a neurological, attention, or reaction-time diagnosis. Browser timing, input latency, refresh rate, focus, and device behavior can change results.

Evidence at a glance

5 intervals per standard run
1000-3500ms easy target range
500-6000ms harder target range
log-ratio proportional timing-error basis
Target source

Seed-generated intervals, with ranges controlled by difficulty.

Measurement

Absolute error, relative error, signed timing bias, and log-ratio timing error.

Report use

Early/late bias, interval-length sensitivity, consistency, and same-seed comparison.

Boundary

Not an ADHD test, neurological test, or medical attention assessment.

Evidence

What authority supports this test?

The app compares target duration and submitted duration using absolute error, relative error, and Weber fraction-style signed error.

The cited timing-perception papers support scalar timing, ratio error, and timing variability language. They do not certify this browser task.

Target fairness

How same-seed comparison stays fair

Bot Challenge is a labeled system rival for immediate comparison.

Friend Challenge and Live Match use the same seed, difficulty, and round count, so both sides reproduce the same hidden intervals.

Limits

What can affect the result?

Input device latency, browser frame timing, attention, audio/visual lag, and refresh rate can change timing results.

Report meaning

What the time report should explain

A useful time report separates accuracy from bias. A user can be consistent but always early, or inconsistent with no stable direction.

The report should also explain device limits because a browser-based timing task includes input and rendering latency.

Result analysis

How to read a time memory result

1 Read accuracy and direction

The total score says how close the reproductions were. Signed error tells whether the user tends to stop early or late.

2 Use relative error

A 200 ms miss means more on a short interval than on a long interval, so proportional error is part of the interpretation.

3 Separate bias from noise

A player can be consistently early, consistently late, or inconsistent with no stable direction. Those are different results.

FAQ

Time memory FAQ

What is a good time score?

A good score means the reproduced intervals were close to the hidden targets with low relative drift across rounds.

Why use ratio error?

A 200 ms miss on a short interval is more meaningful than the same miss on a long interval, so proportional error matters.

Can browser latency affect results?

Yes. Input device, refresh rate, browser scheduling, and focus can affect timing precision.

Can this diagnose attention problems?

No. It is an interval-reproduction assessment, not a clinical diagnosis.

Shape memory direct answer

Shape Memory Test

Shape Memory Test measures short-term spatial recall. You see a generated shape, then recreate its position, scale, and rotation.

The report compares target and submitted geometry with raster overlap plus drift measures. Shape similarity needs more than one number because position, scale, and rotation errors can look different.

This is not a motor-control, visual-spatial disorder, or clinical drawing assessment. Pointer precision, screen size, viewport scale, and touch input can change performance.

Evidence at a glance

5 shapes per standard run
64x64 raster overlap comparison grid
IoU Jaccard-style overlap basis
4 tracked errors: overlap, center, scale, rotation
Target source

Seed-generated circles, polygons, and stars with controlled position, rotation, and scale.

Measurement

Raster overlap / Jaccard-style comparison plus center, scale, and symmetry-aware rotation drift.

Report use

Outline overlap, center drift, rotation drift, scale drift, and round-by-round consistency.

Boundary

Not a clinical visual-spatial test, motor test, or drawing-skill certificate.

Evidence

What authority supports this test?

The app compares target and submitted geometry with a 64x64 raster overlap score, then applies symmetry-aware rotation and scale penalties.

The cited overlap references support Jaccard / IoU-style binary image comparison language. They do not certify the memory task.

Target fairness

How same-seed comparison stays fair

Bot Challenge is labeled as a system rival and uses deterministic comparison pressure.

Friend Challenge and Live Match use the same seed, difficulty, and round count, so both sides recreate the same target geometry.

Limits

What can affect the result?

Pointer precision, touch-screen size, motor control, viewport size, and visual attention can affect results.

Report meaning

What the shape report should explain

A useful shape report explains whether the miss came from where the shape was placed, how large it was, or how it was rotated.

The report should avoid overclaiming because pointer device and viewport size can strongly affect a geometry recreation task.

Result analysis

How to read a shape memory result

1 Use overlap first

Overlap explains how much the submitted shape shares area with the target, which is a better summary than center position alone.

2 Split the geometry

Position drift, scale drift, and rotation drift should be separated because the same total score can come from different visual mistakes.

3 Account for input limits

Pointer precision, touch screens, and viewport size can change results, so repeated same-device runs are the fairest comparison.

FAQ

Shape memory FAQ

Why use overlap?

Overlap captures how much the submitted shape shares area with the target, which is more useful than checking only center position.

Why include rotation and scale?

Two shapes can overlap poorly for different reasons, so the report separates rotation, scale, and center drift.

Can touch screens change scores?

Yes. Screen size, touch precision, pointer device, and viewport scale can affect shape placement.

Can this diagnose spatial ability?

No. It is a browser-based recall task, not a clinical assessment.

SBTI direct answer

What is the SBTI Test?

SBTI is a structured self-report personality test. It uses 30 core questions to score 15 dimensions, then matches the pattern to 27 character archetypes.

The result is designed to be readable and shareable: a character card, type code, prototype distance, share code, Big Five-informed preview, and a deeper report hook.

SBTI is not an official MBTI, IPIP, BFI, NEO, clinical, hiring, or school assessment. It is a self-report interpretation layer with clear limits.

Evidence at a glance

30 core questions
15 scored dimensions
27 character archetypes
OCEAN Big Five-informed explanation layer
Self model

S1 / S2 / S3

Identity signal, self-worth, and control boundary.

Emotion model

E1 / E2 / E3

Emotional depth, expression, and pressure response.

Action model

A1 / A2 / A3

Drive, risk preference, and closure pressure.

Attention model

Ac1 / Ac2 / Ac3

Detail lock, pattern speed, and noise filtering.

Social model

So1 / So2 / So3

Social gravity, performance need, and relationship stickiness.

How it scores

How answers become a personality result

1Answer 30 questions

Each item contributes to a dimension; one answer does not decide the type alone.

2Build 15 dimension scores

Two items form each dimension, then the score is compressed into L / M / H.

3Compare prototype distance

The 15-dimension pattern is compared against 27 type templates.

4Generate report hooks

The result shows closest type, runner-up, OCEAN preview, and locked deep-report sections.

Result reading

How to analyze an SBTI result

1Read the character first

The character card is the memorable summary. It should make the type easy to recognize and share.

2Check why it matched

Prototype distance, runner-up contrast, and 15 dimensions explain why this type won over nearby types.

3Use life-context sections

Love, friendship, work, and growth sections translate the dimension pattern into practical interpretation without treating it as diagnosis.

27 archetypes

The 27 SBTI types are not random labels

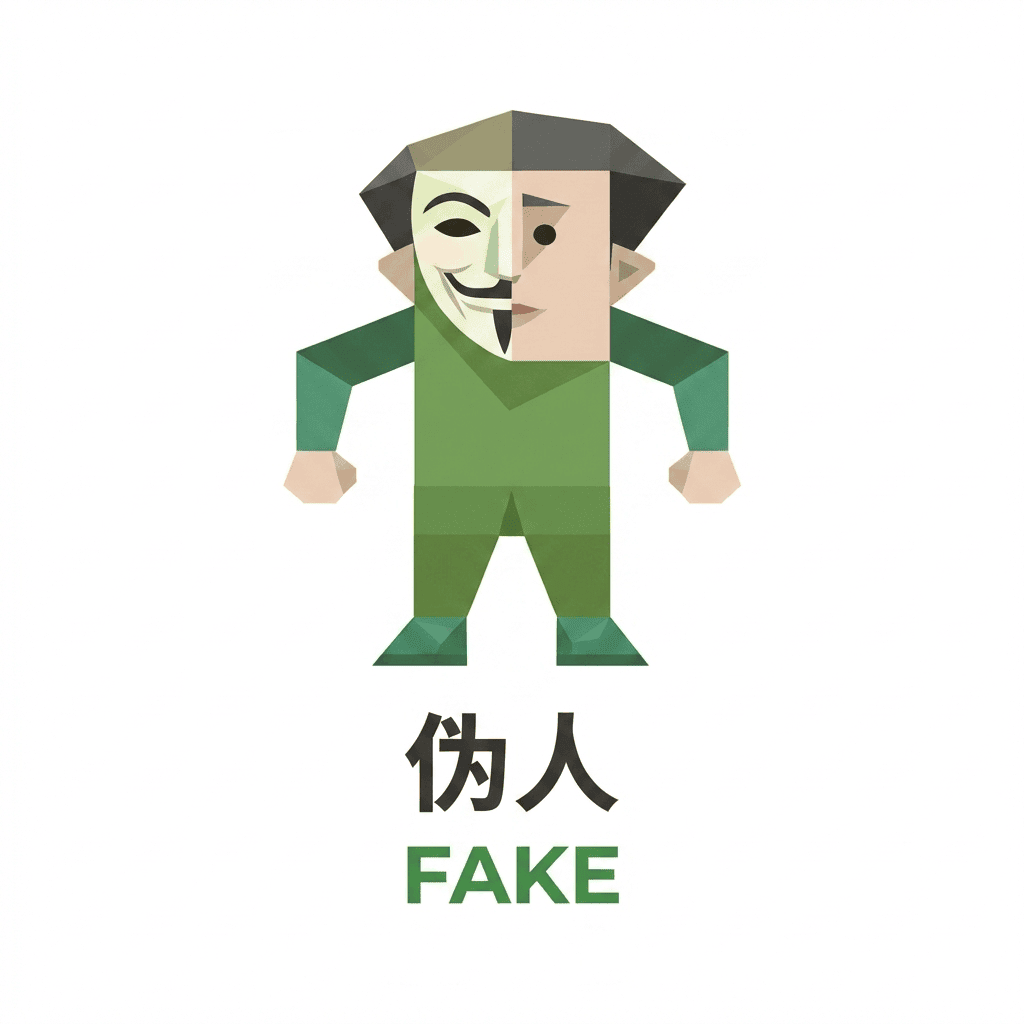
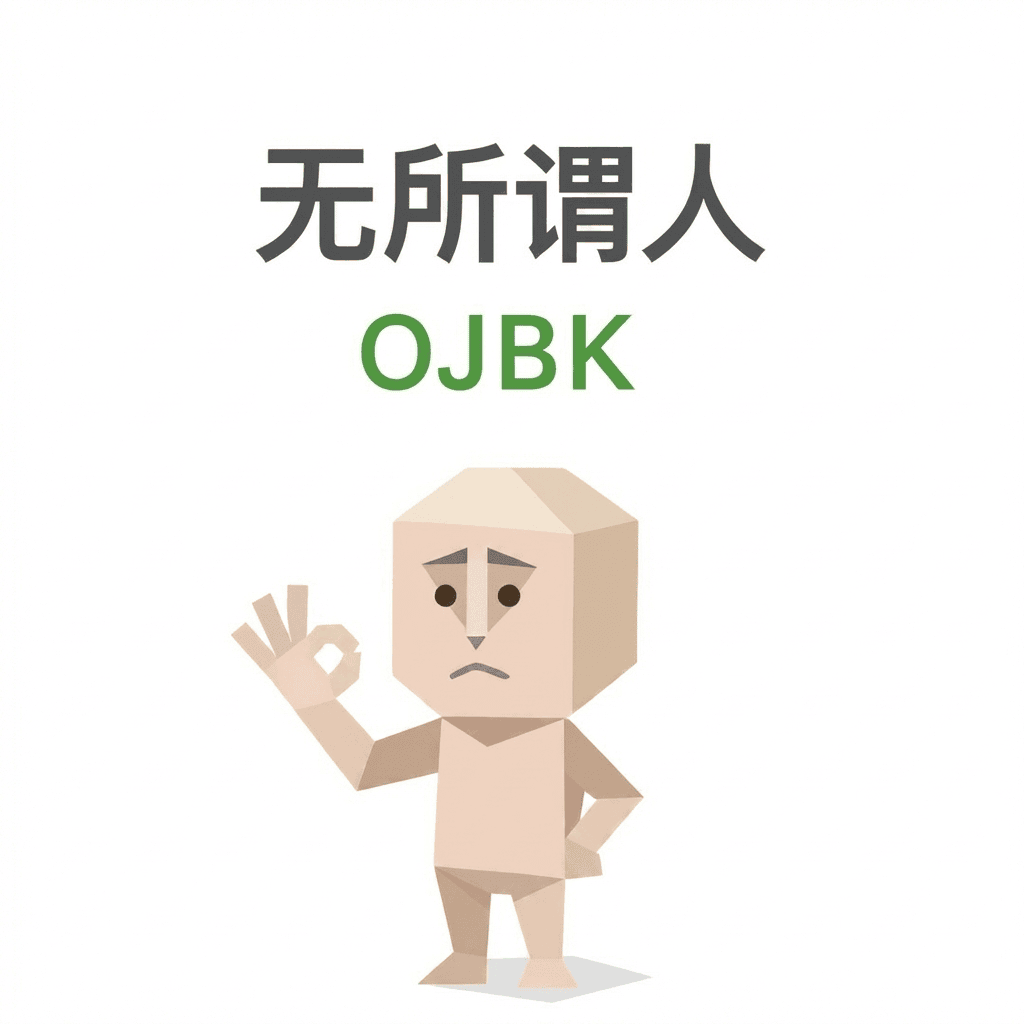
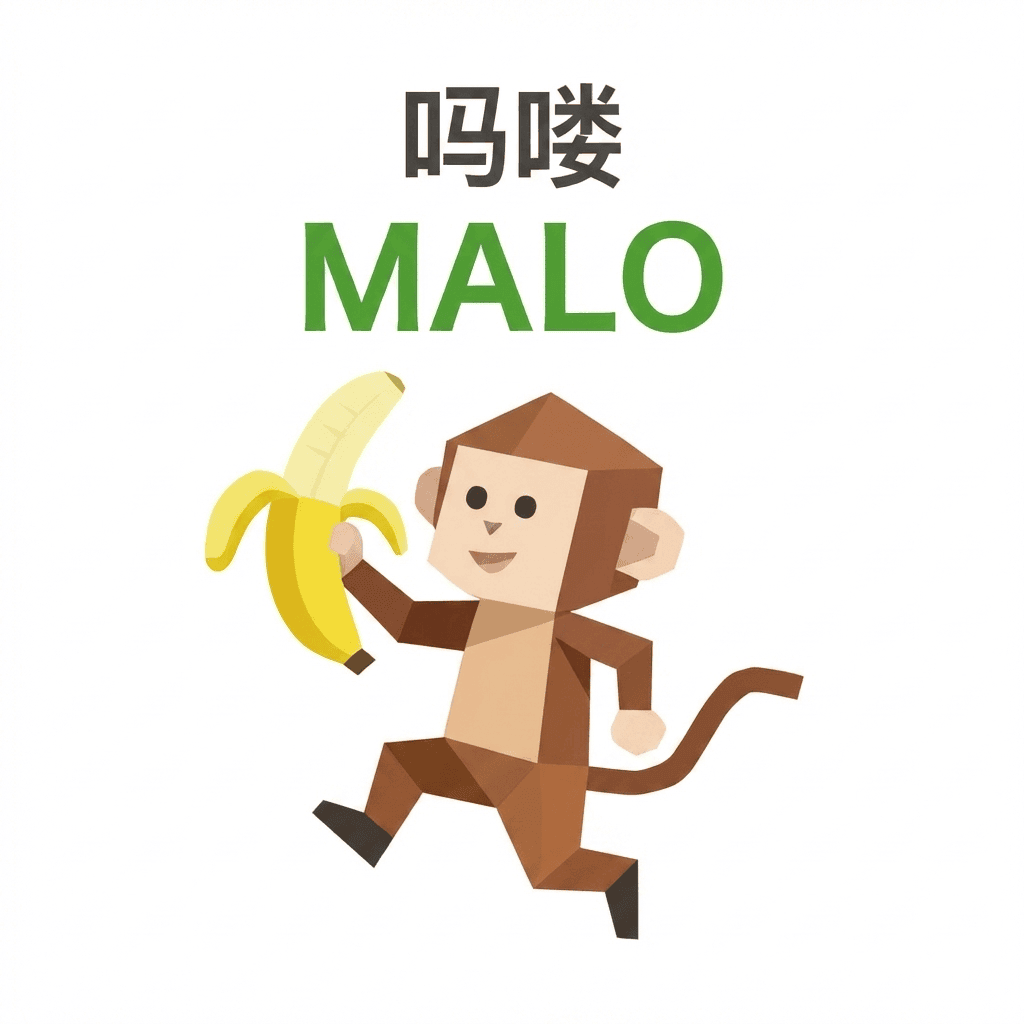
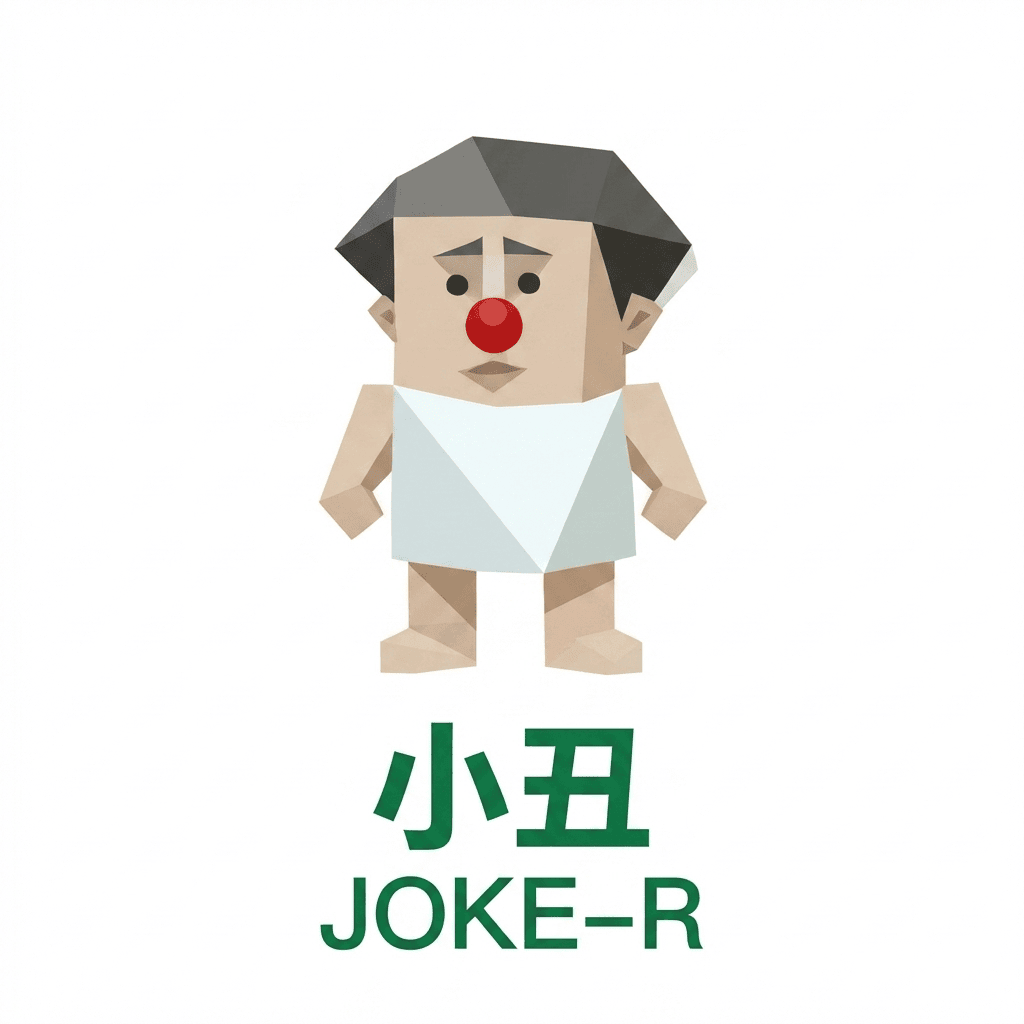
Each type has a fixed 15-dimension template, character image, and report framing. The funny names are the shareable layer; the matching still comes from dimension distance.

Why

Why take SBTI?

Many personality tests stop at a label. SBTI is designed to show why the label happened: what dimensions pulled you toward this character, where the runner-up differs, and what that implies in relationships, work, friendships, and future choices.

Big Five

How SBTI uses Big Five

SBTI handles the archetype and character card. The Big Five-informed OCEAN layer explains tendencies such as Openness, Conscientiousness, Extraversion, Agreeableness, and Neuroticism. It is not an official Big Five instrument.

Report

What the full report should unlock

The free result should keep curiosity high without dumping everything. A full report can unlock prototype distance, 15-dimension evidence, OCEAN tension, runner-up contrast, love, friendship, work, future direction, and growth prompts.

Privacy

Privacy and local calculation

The current test calculates in the browser and does not require registration. Share codes should not contain real identity or sensitive personal information.

SBTI vs MBTI

How is SBTI different from MBTI?

Result format27 character archetypes + 15 dimensionsFour preference pairs
Sharing layerCharacter art, code, meme-friendly label, share codeType letters and explanations
InterpretationSBTI archetype + Big Five-informed OCEANPreference-dimension interpretation
LimitsEntertainment self-report, not clinical or hiring useAlso should not be overused for serious decisions

Featured types

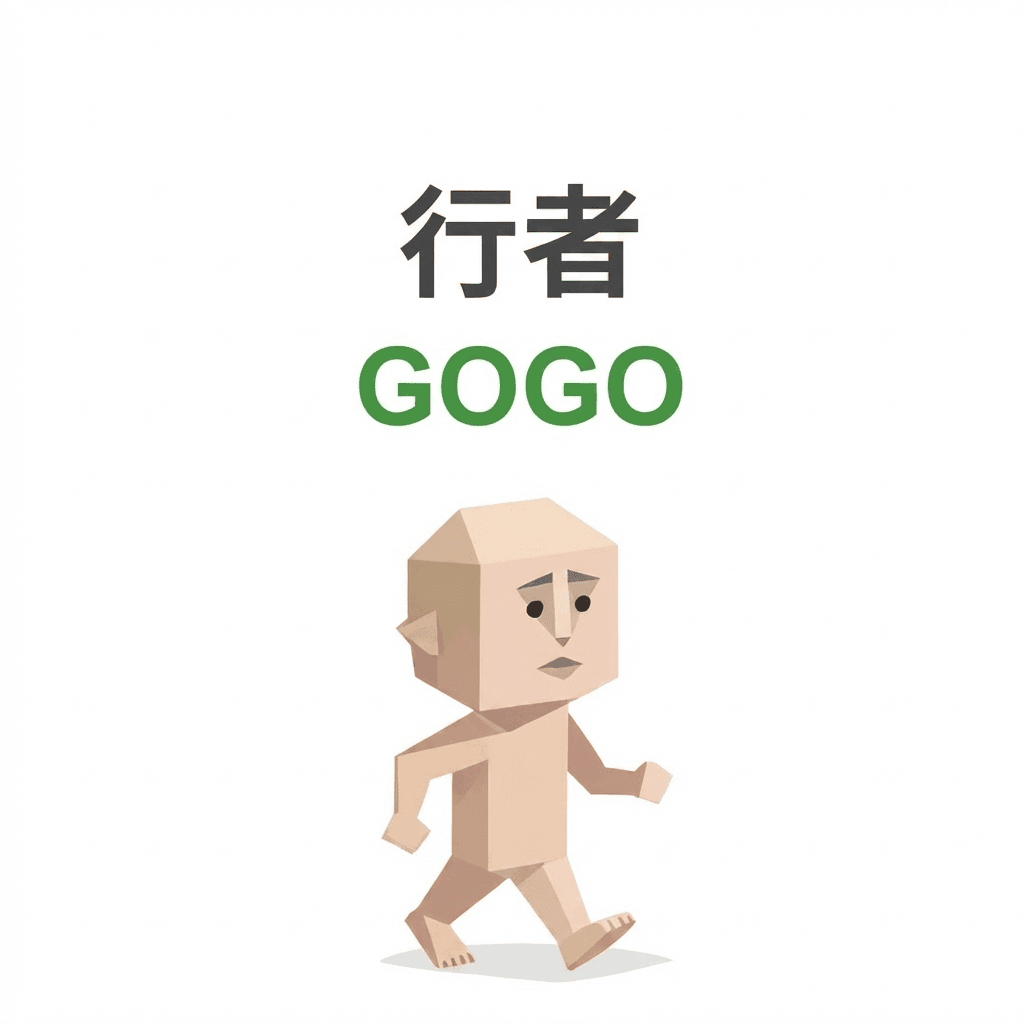
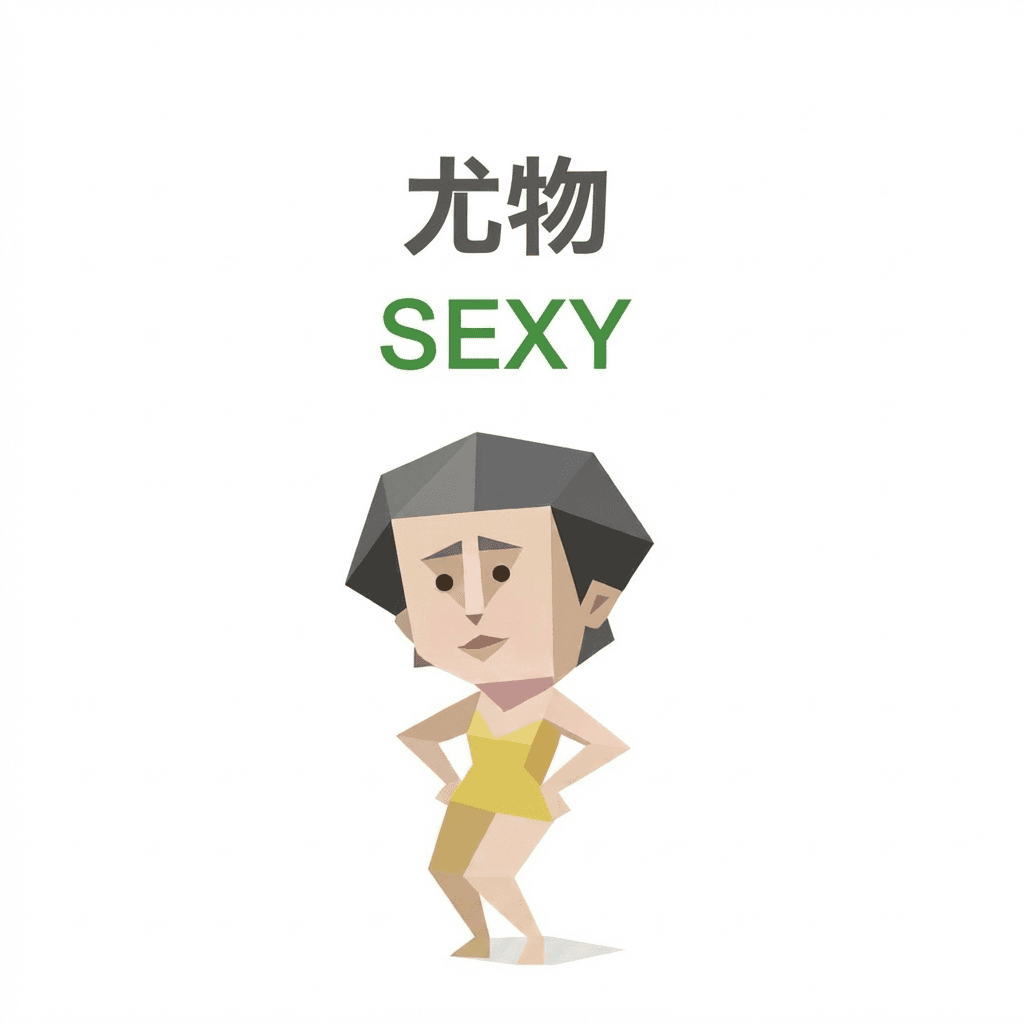
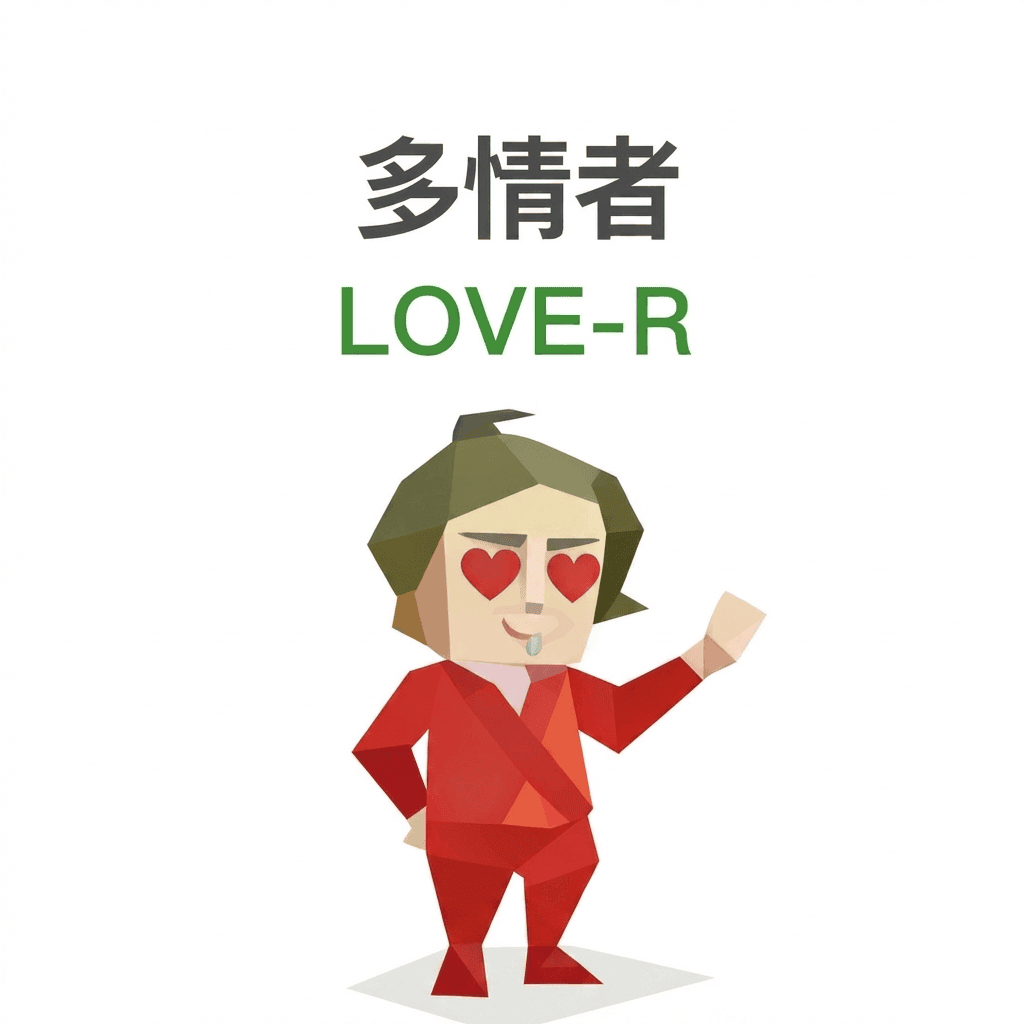
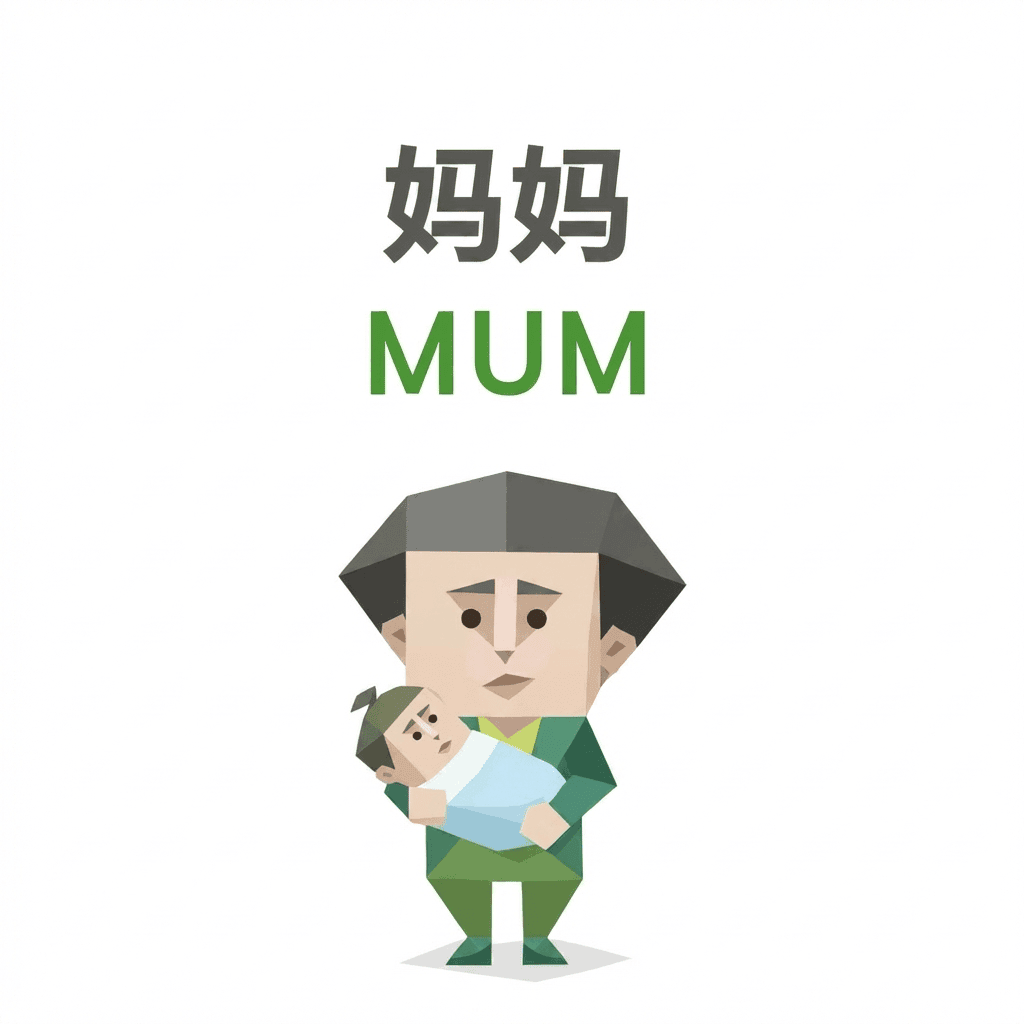
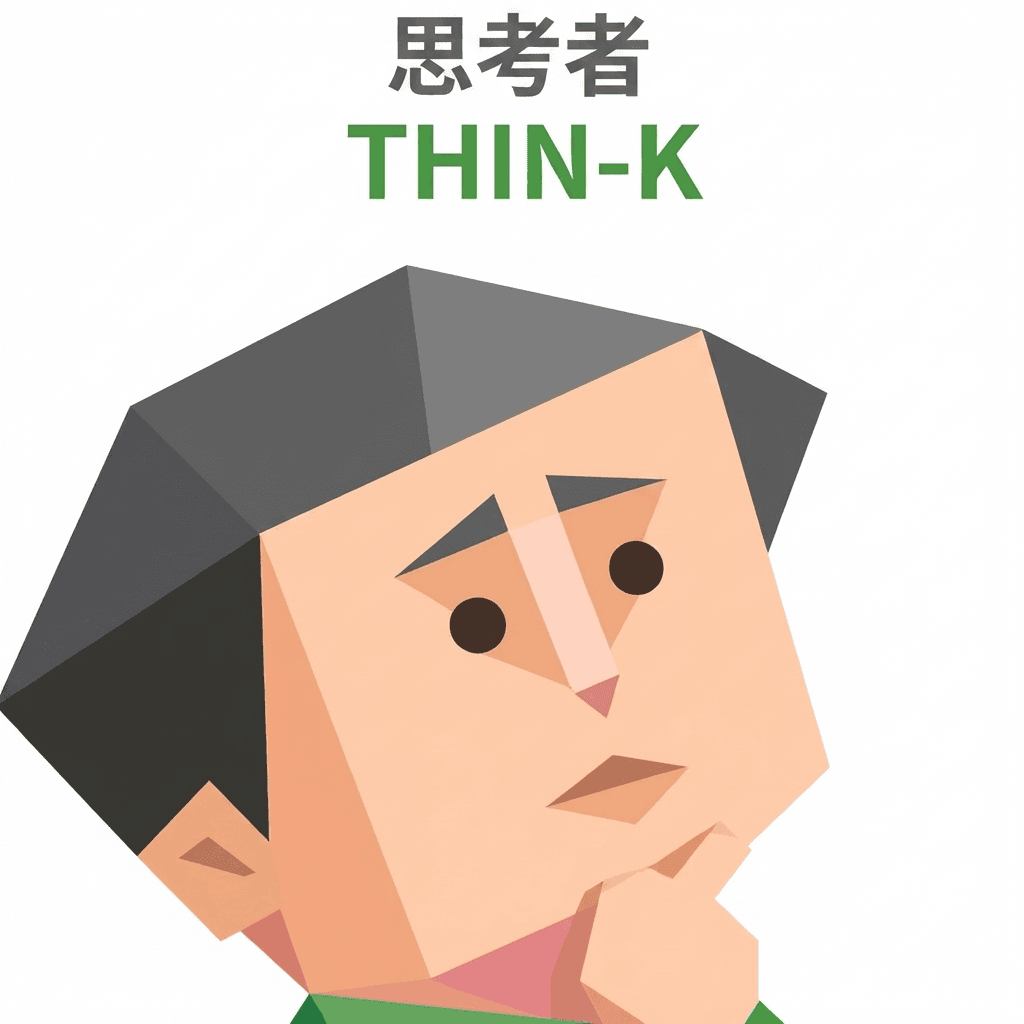
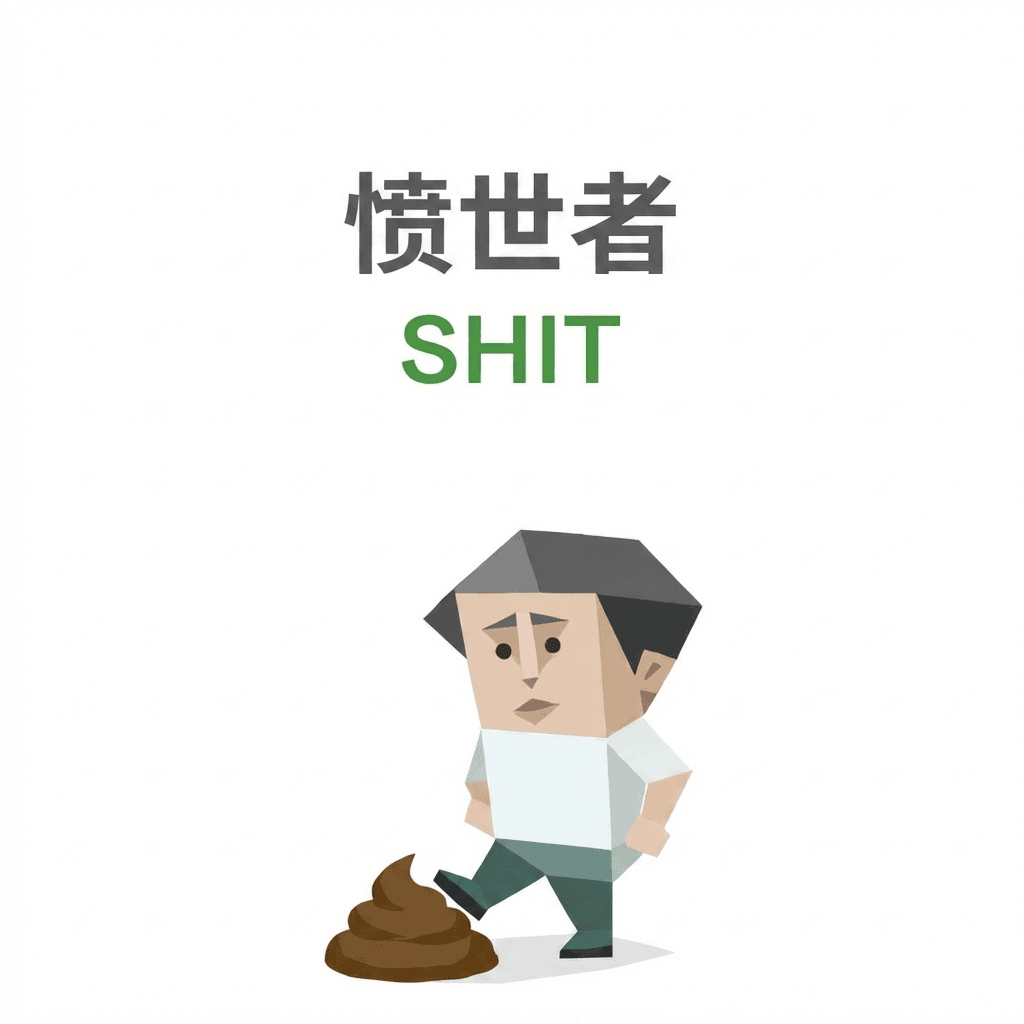
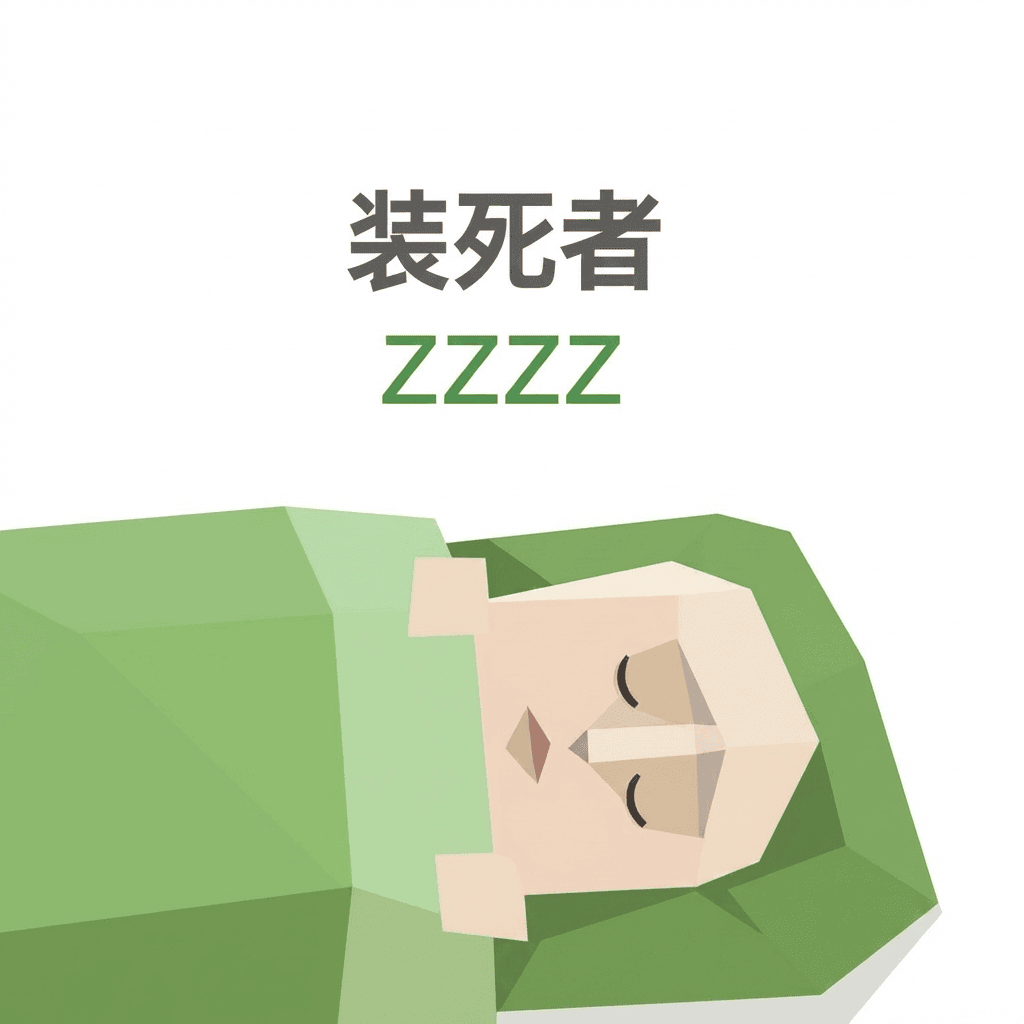
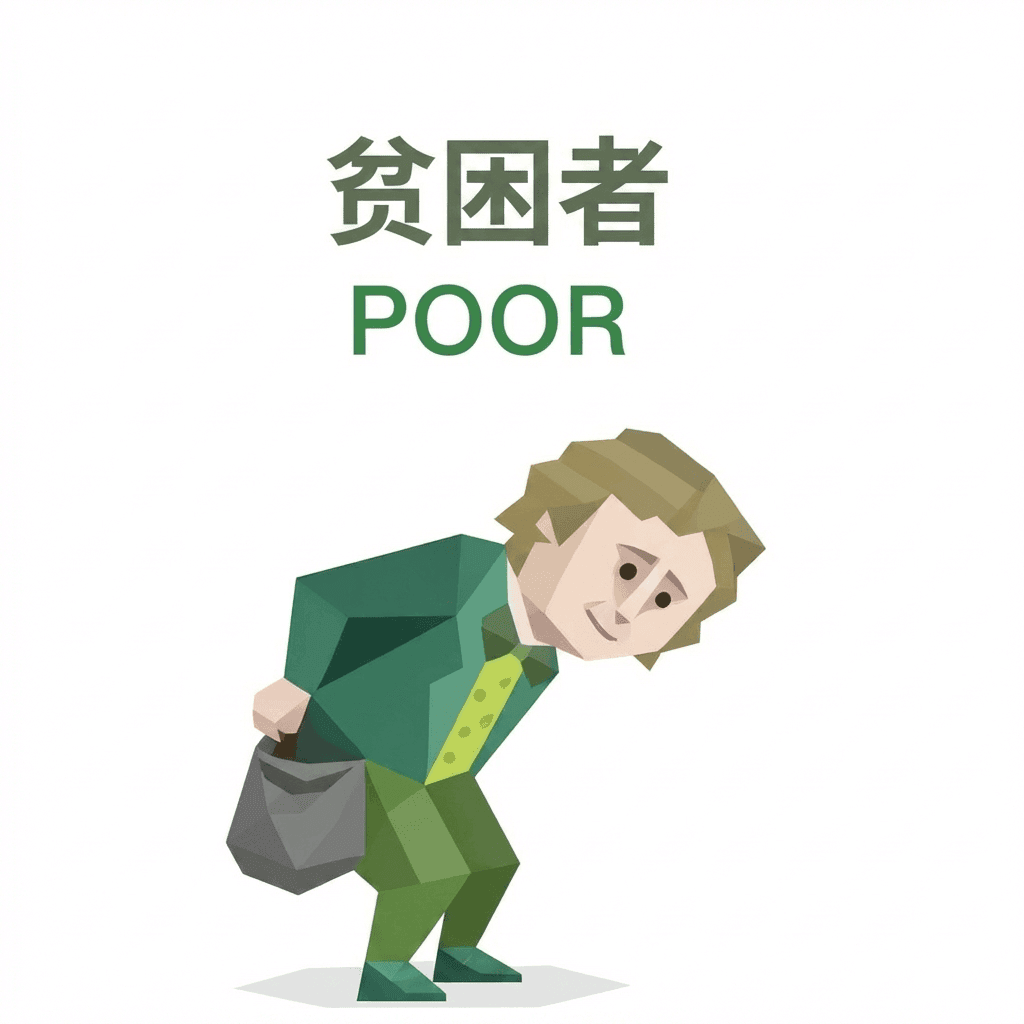
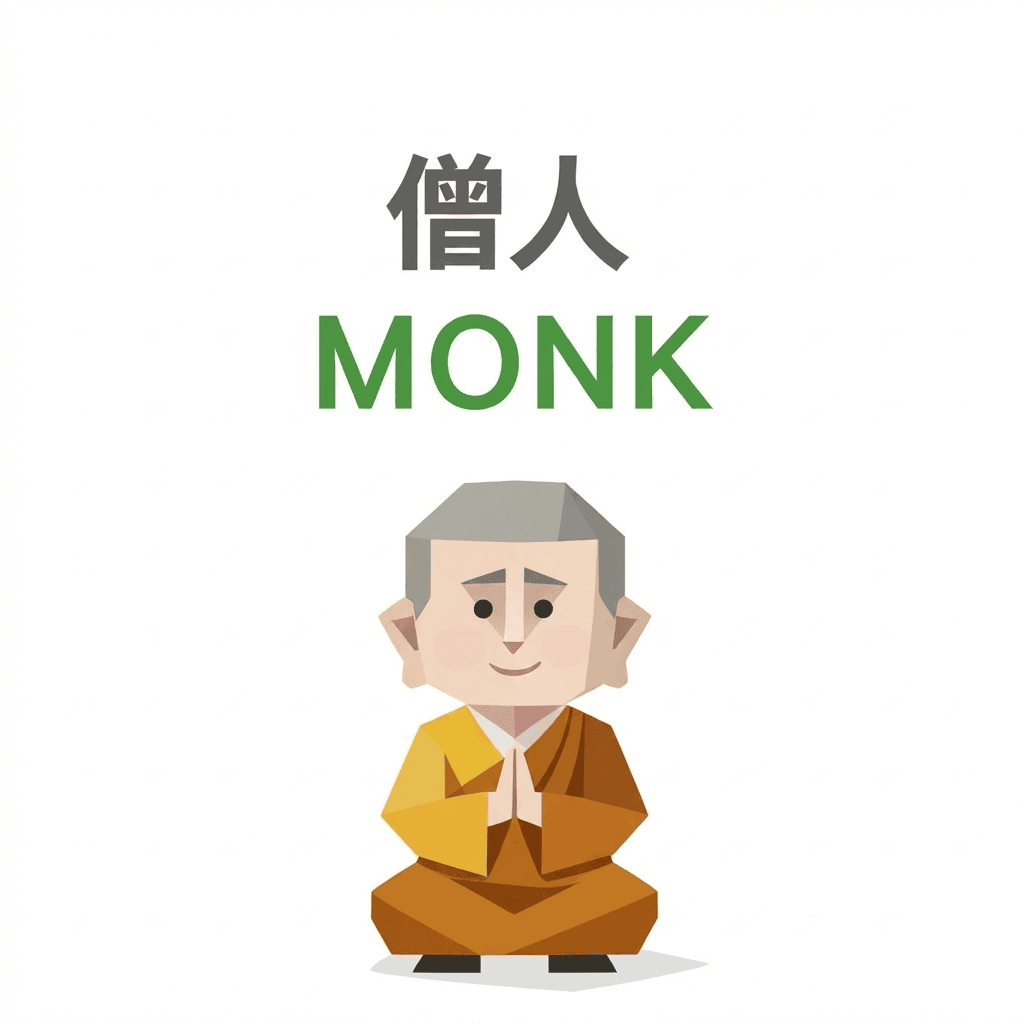
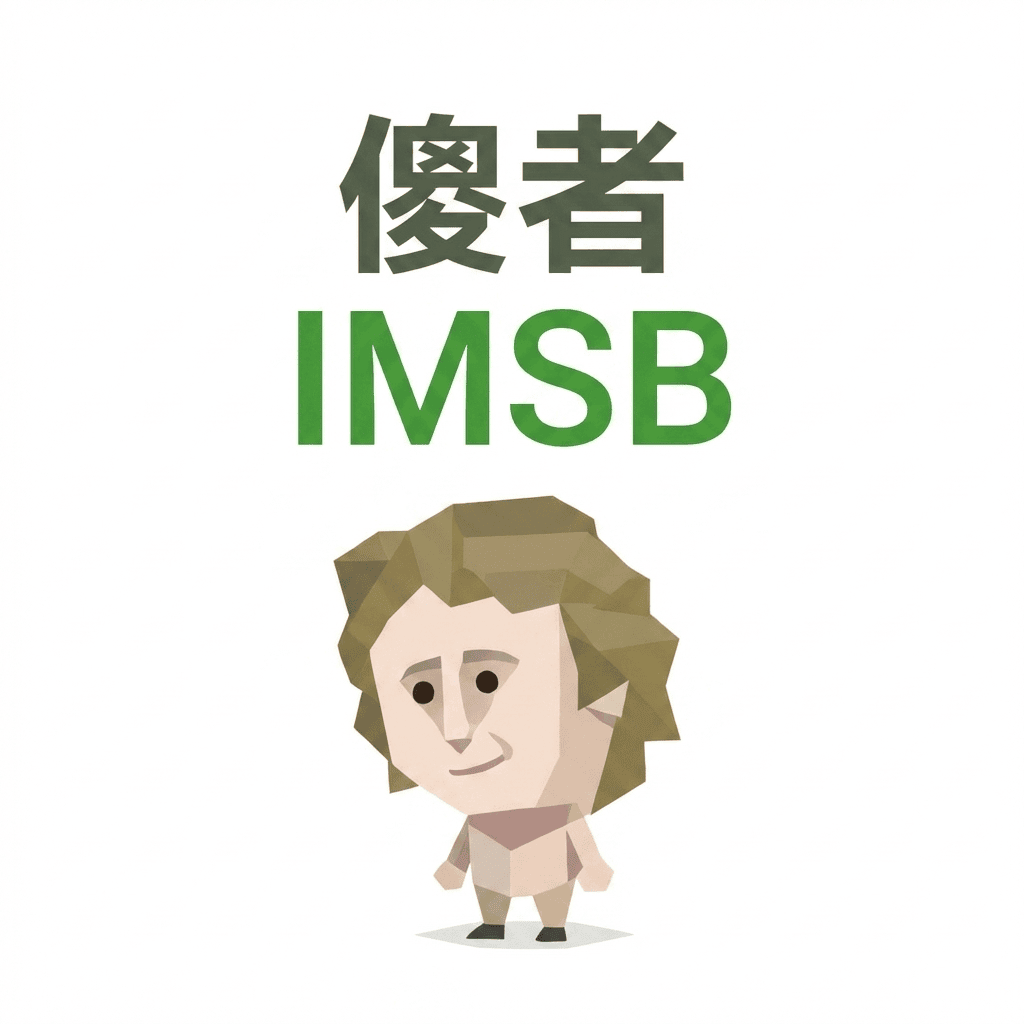
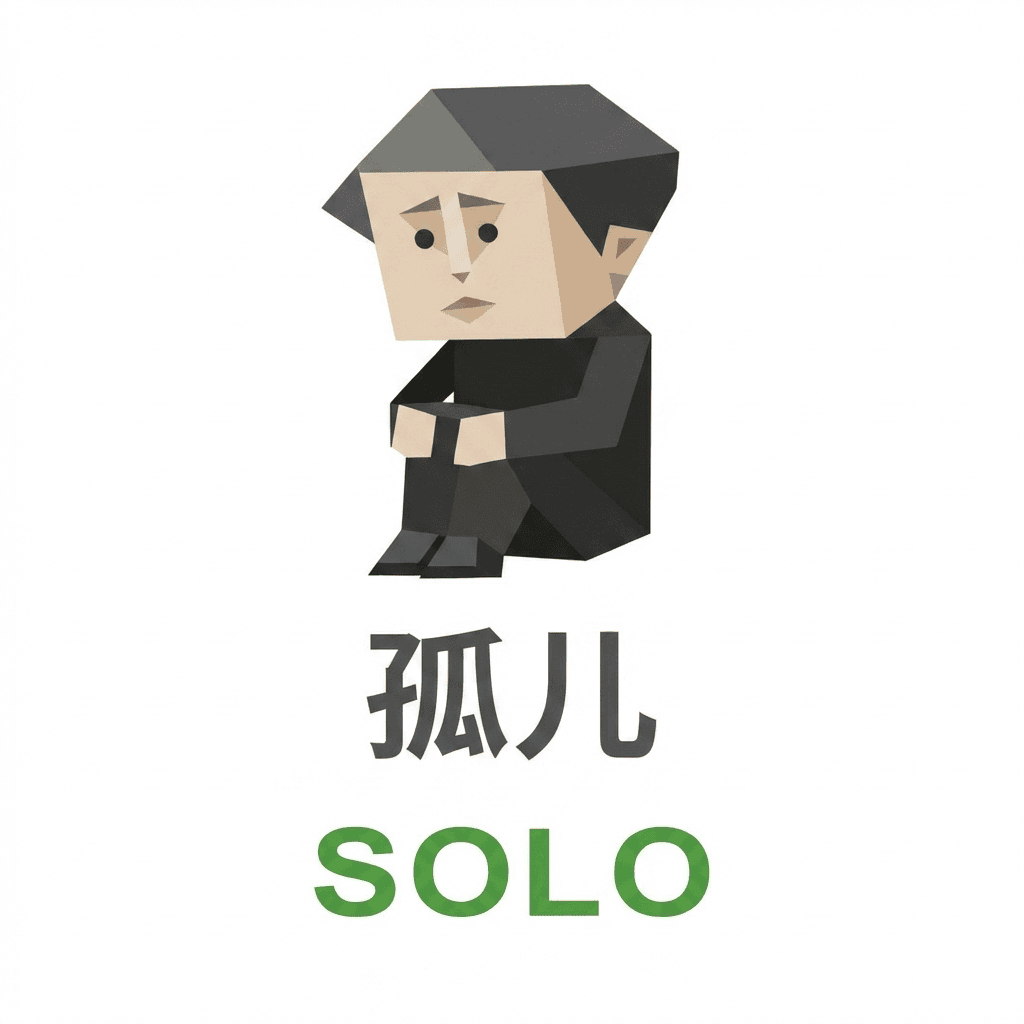
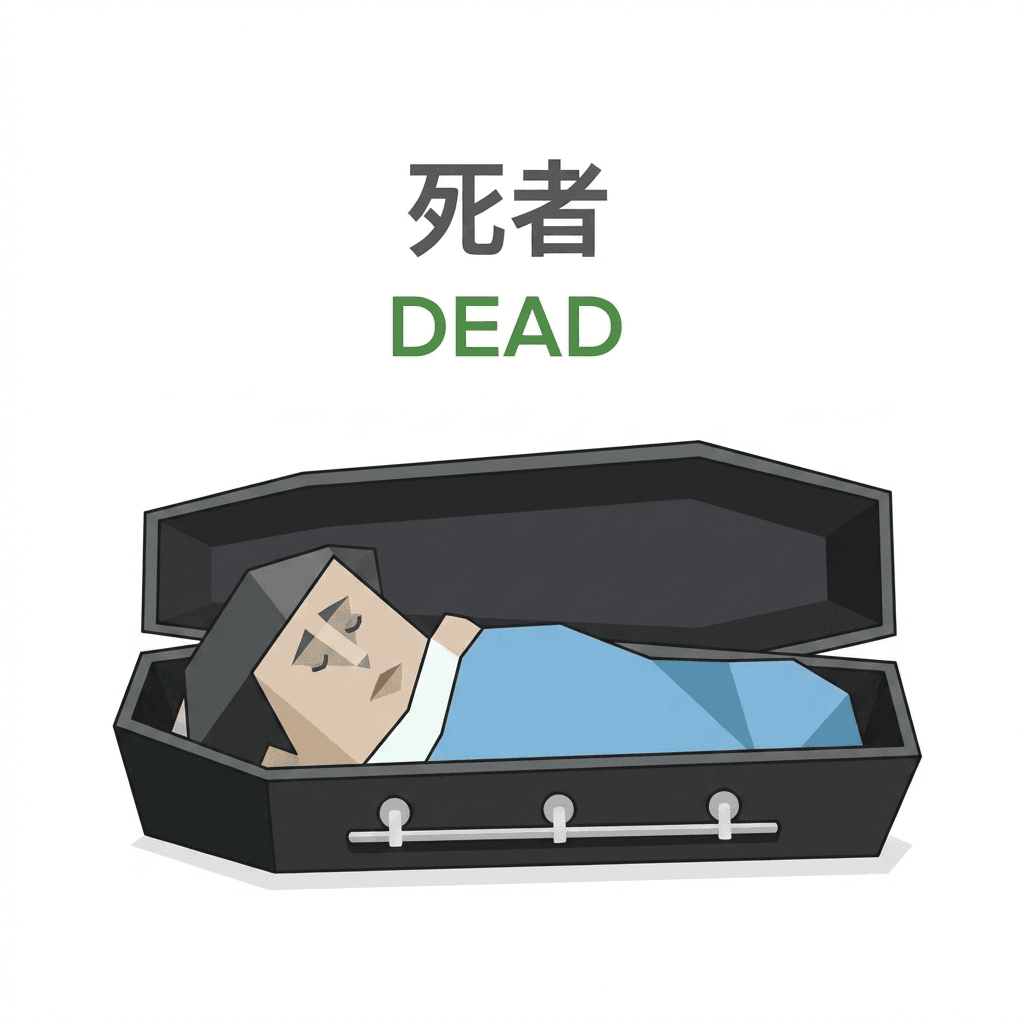
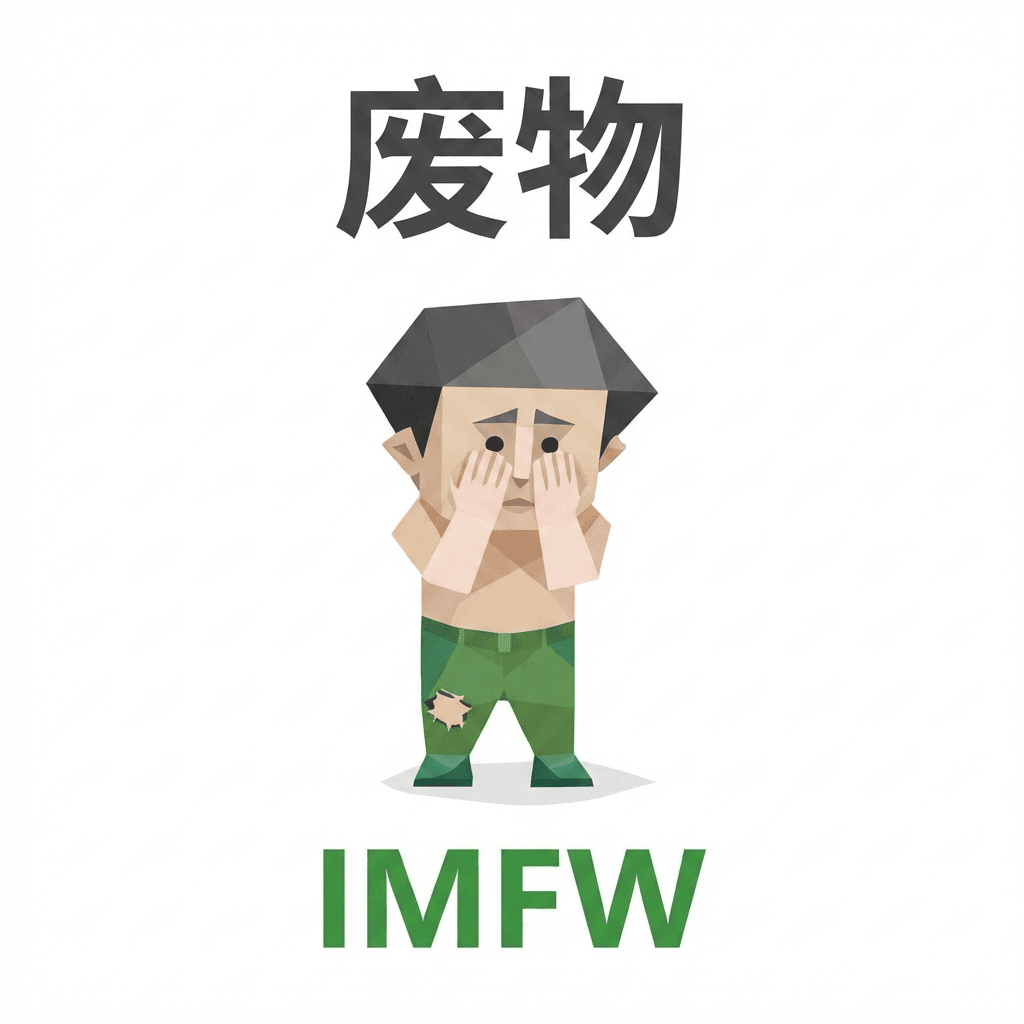
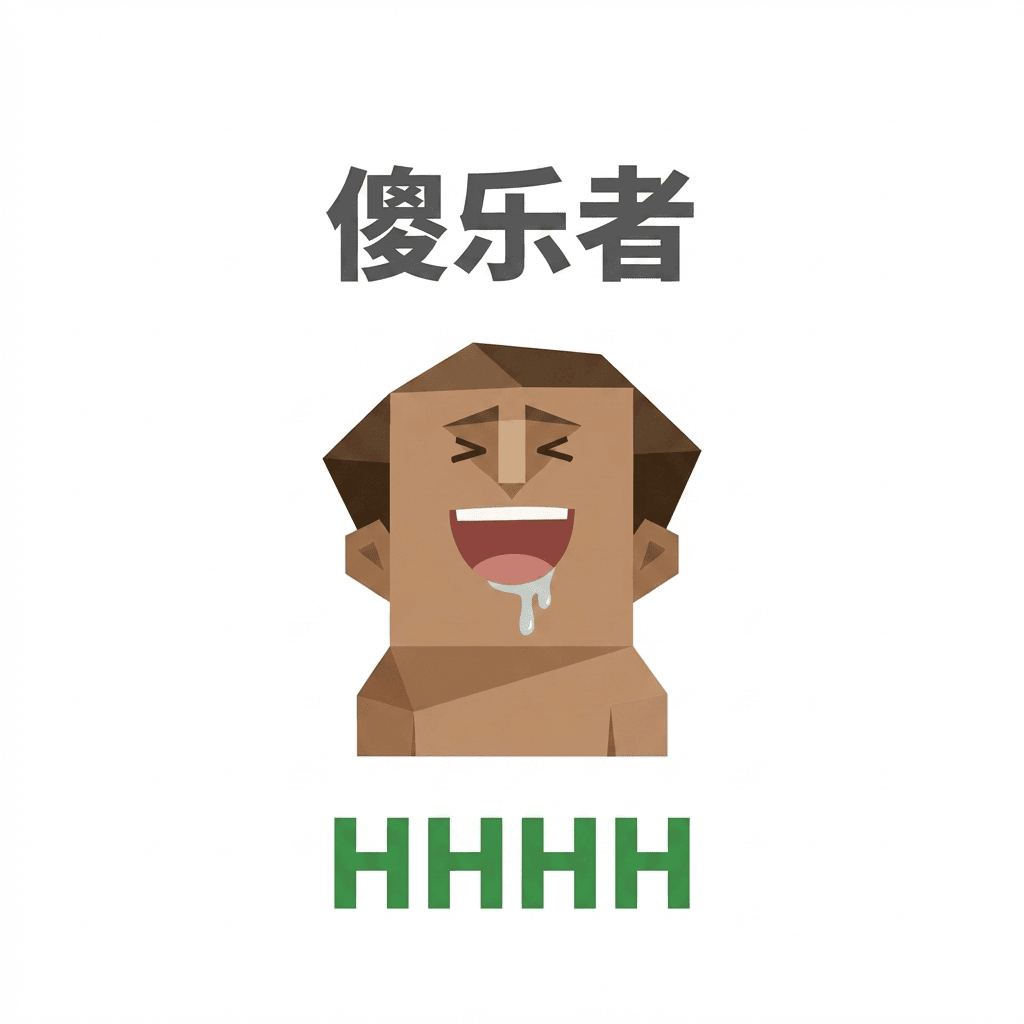
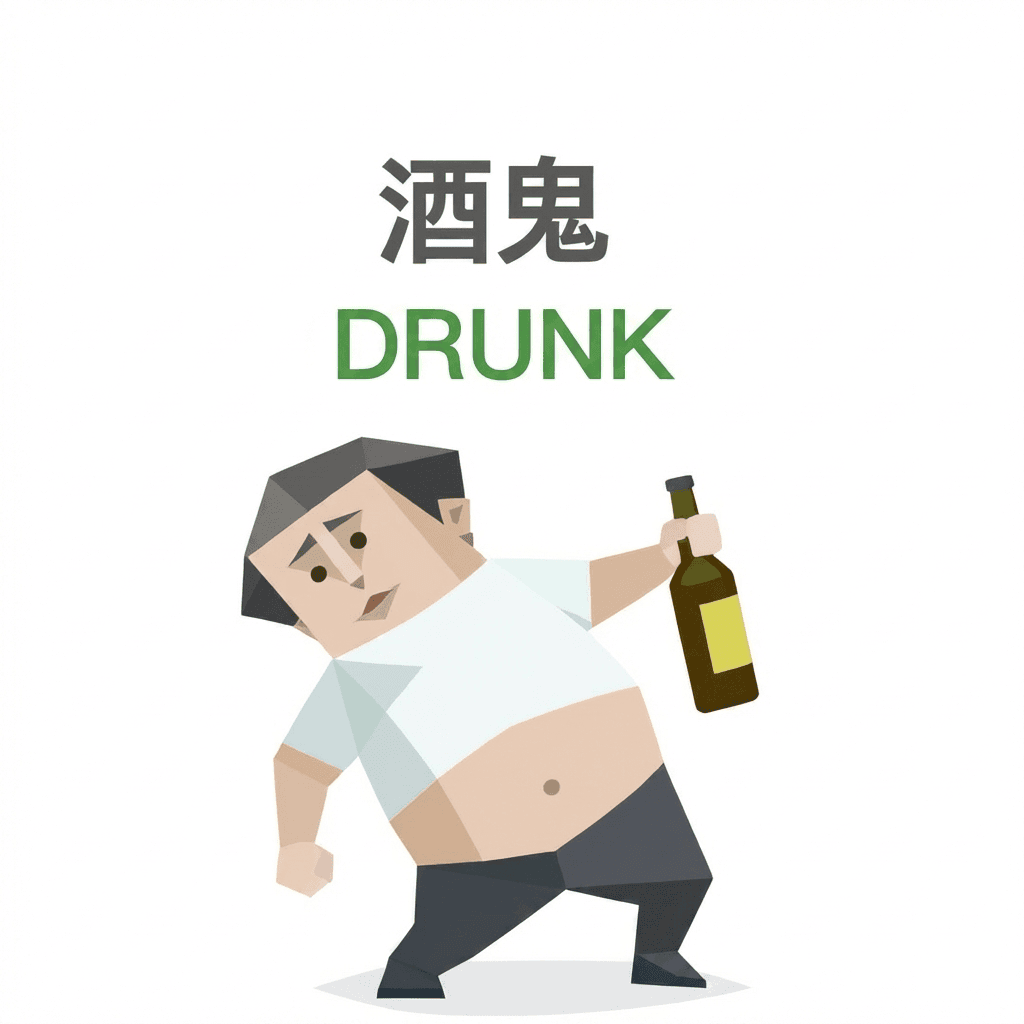
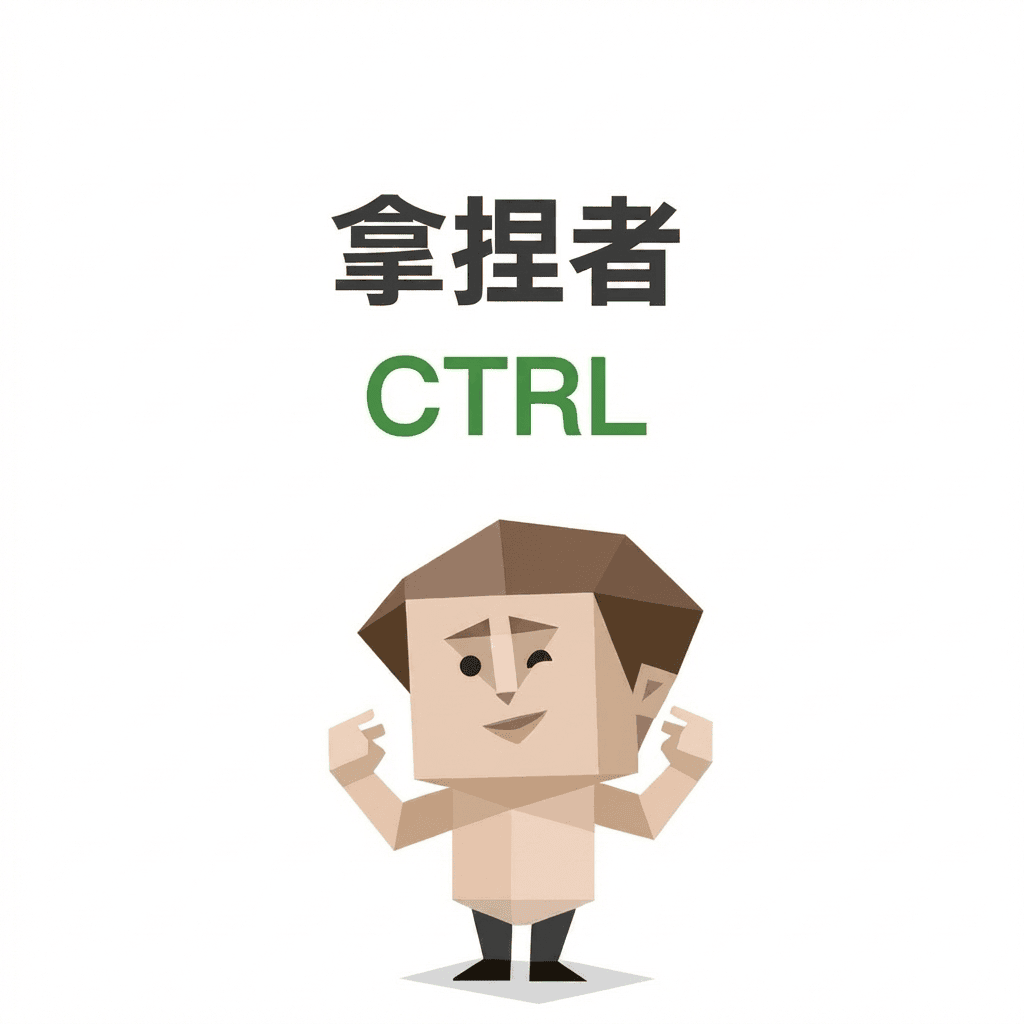
Why do results like CTRL, BOSS, or DRUNK exist?

FAQ

FAQ

Are SBTI questions random?

No. The core test uses 30 fixed questions across 15 dimensions, with one visible gate and an optional hidden trigger.

What does prototype distance mean?

Lower distance means your 15-dimension L/M/H pattern is closer to a type template. Higher distance means you should read runner-up and dimension evidence carefully.

Why does the report discuss love, friendship, and work?

Those sections translate self, emotion, action, attention, and social dimensions into practical life contexts. They are interpretation, not diagnosis.

Can SBTI be used as a formal psychological test?

No. It is for self-reflection and social discussion, not medical, hiring, school, or high-stakes decisions.